
There are now 49 million cat-owning households in the United States alone — a 23% jump in a single year, according to the American Pet Products Association’s 2025 report. Globally, an estimated 350–373 million cats live as pets, in homes ranging from rural Russia (where 59% of households own a cat) to rapidly urbanising Chinese cities. This page aggregates data from the APPA, AVMA, FEDIAF, and peer-reviewed journals to give you the most complete picture of cat ownership in 2026.
Global Cat Population Statistics
| Statistic | Figure | Source |
|---|---|---|
| Estimated global pet cat population | 350–373 million | PetsCare / World Animal Foundation, 2025 |
| Estimated stray/feral cat population globally | ~480 million | PetsCare, 2025 |
| Total global cat population (all categories) | 600 million – 1 billion+ | Multiple sources, 2025 |
| Pet cats in the European Union | ~113 million | FEDIAF, 2024 |
| Cats as share of pet adoptions (US, 2023) | 54% | Catster, 2023 |
| Global pet care market value | $259.37 billion | World Animal Foundation, 2024 |
Cat Ownership by Country
Cat ownership rates vary dramatically by country, reflecting cultural attitudes, urbanisation patterns, and income levels. Russia stands apart as the world's most cat-dense nation by household ownership rate.
| Country | Pet Cat Population | Notes |
|---|---|---|
| United States | 74 million | 49 million cat-owning households (APPA 2025) |
| China | 53–71.5 million | Fastest-growing market |
| Russia | 23–49 million | Highest ownership rate globally — 59% of households |
| Germany | 15.2 million | FEDIAF |
| France | 14.9–15 million | ~2× more cats than dogs |
| Romania | — | Highest % cat-owning households in Europe (48%) |
| New Hampshire (US) | — | 163 cats per 100 dogs — most cat-dense US state |
Russia's extraordinary ownership rate reflects a deeply rooted cultural relationship with cats, particularly in urban apartments. France stands out in Europe for having roughly twice as many pet cats as dogs, bucking the European trend toward canine dominance.

US Cat Ownership Statistics
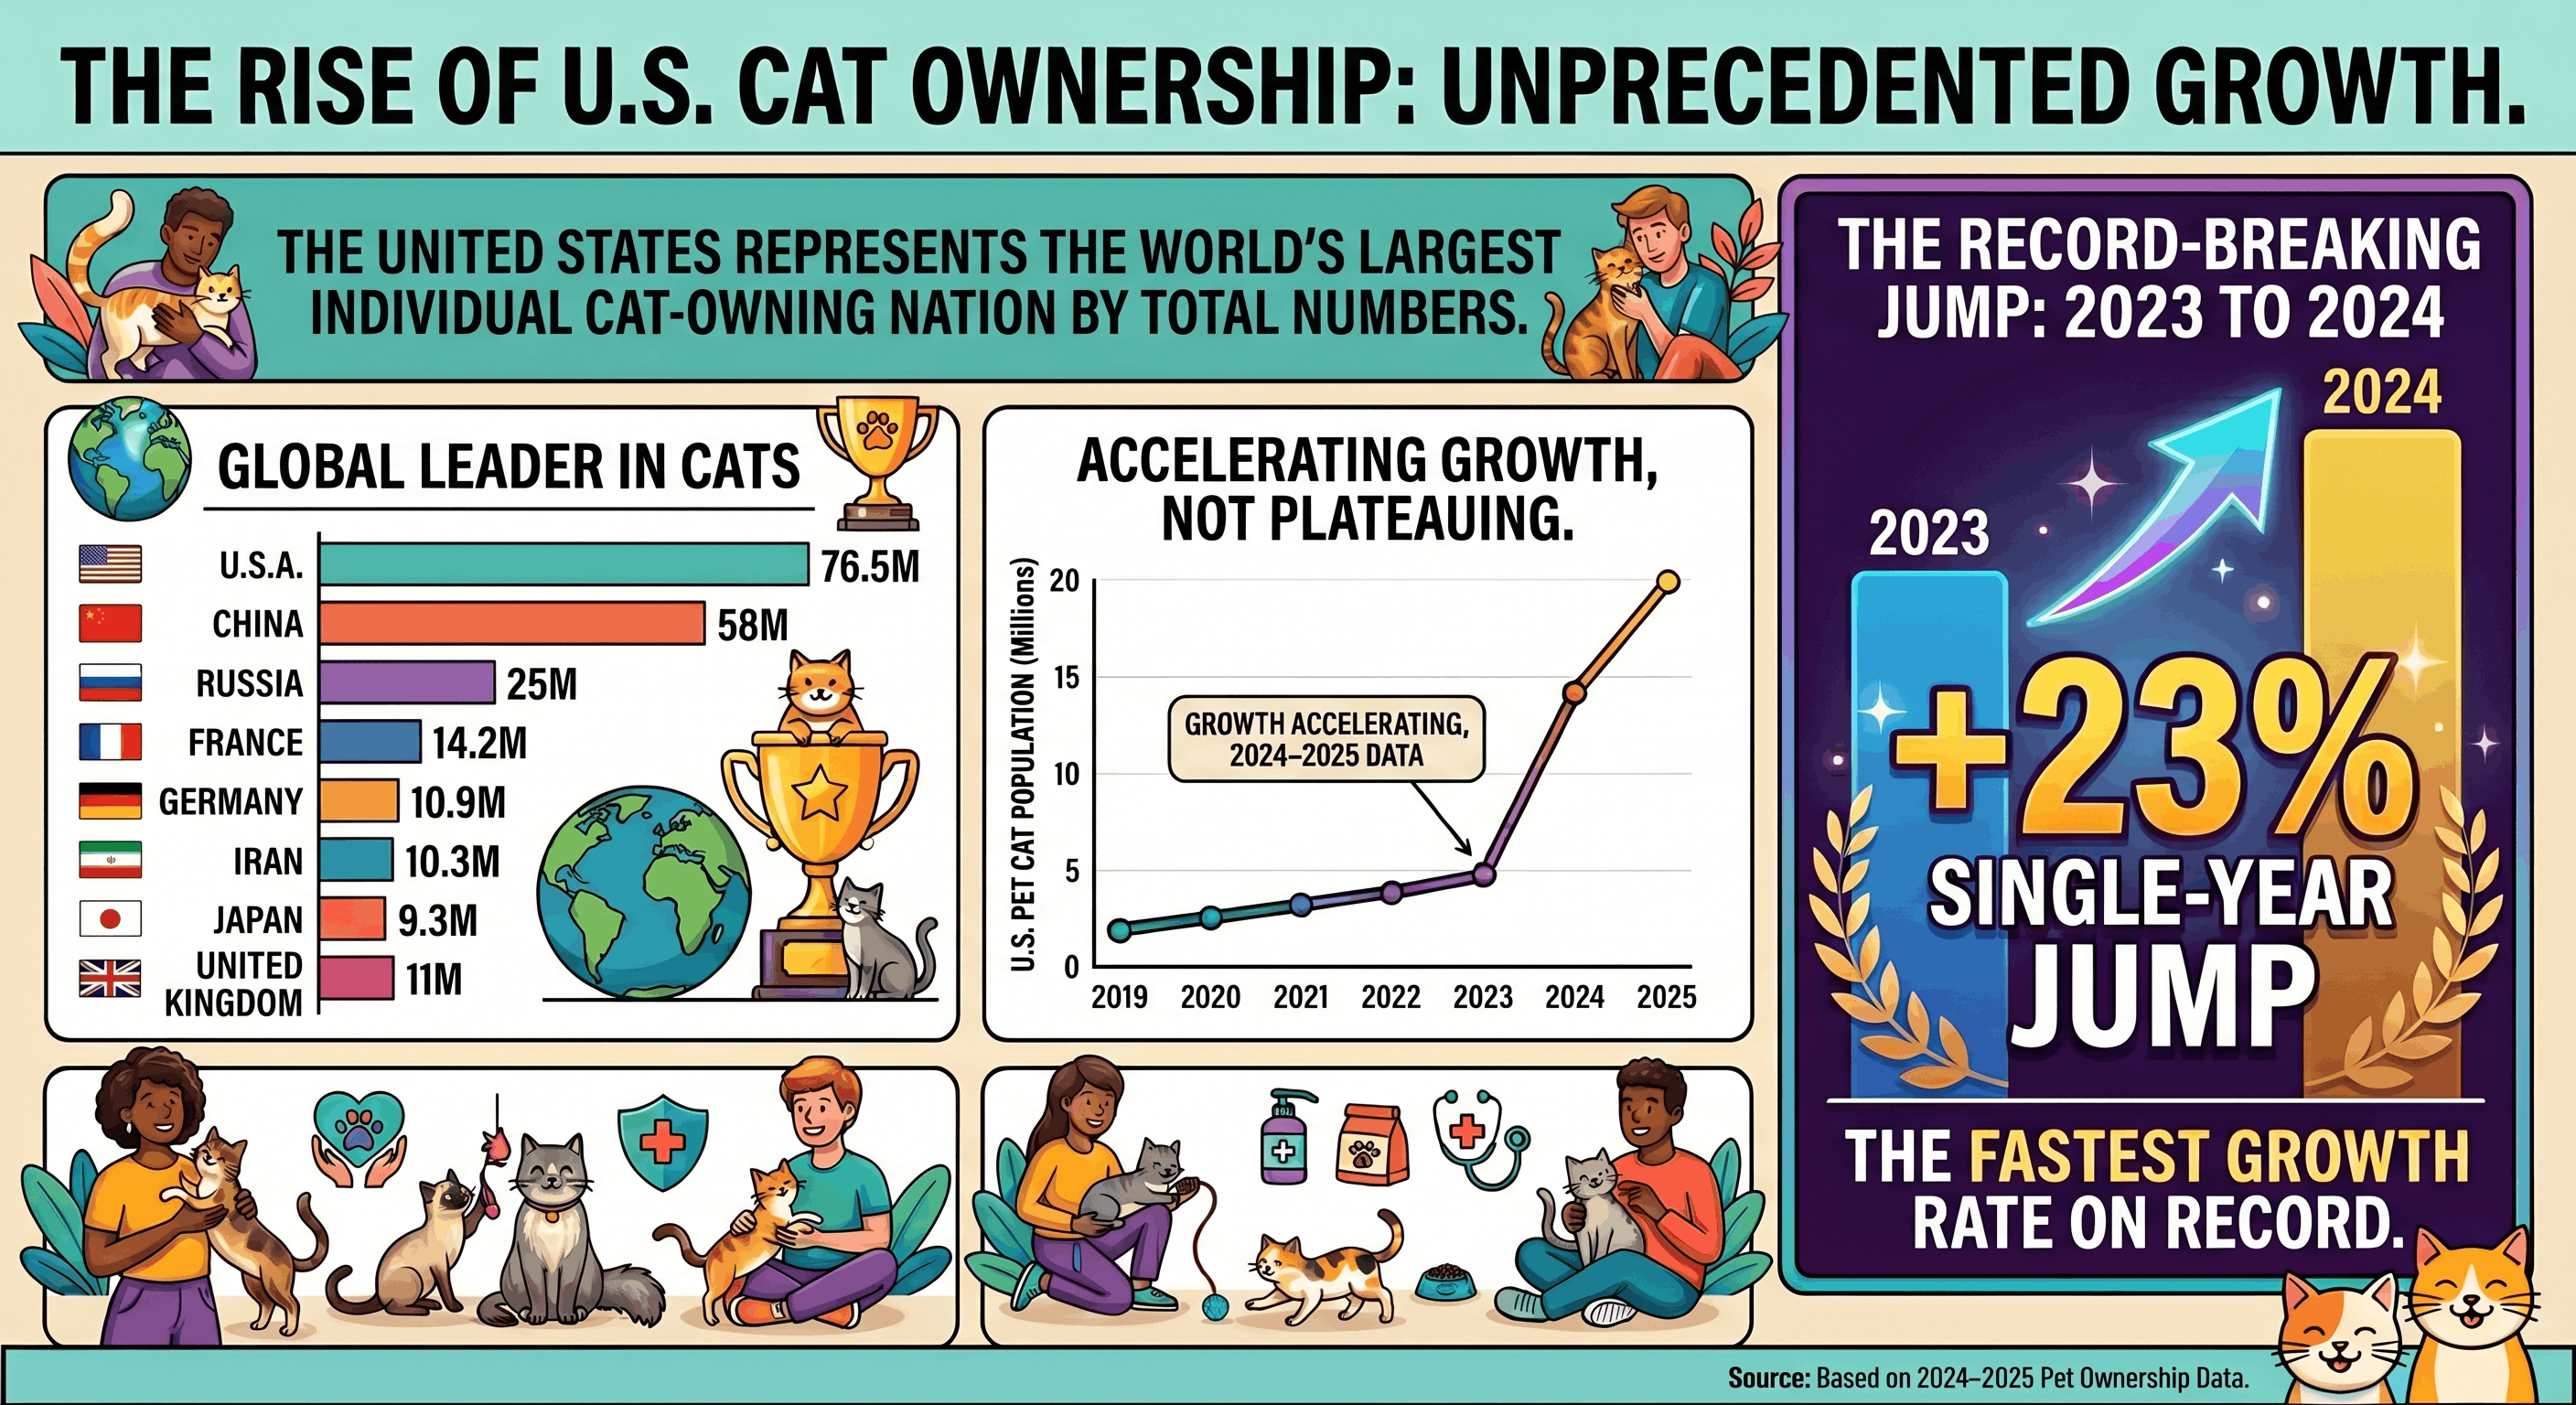
The United States represents the world's largest individual cat-owning nation by total numbers, and 2024–2025 data shows that growth is accelerating rather than plateauing. The 23% single-year jump from 2023 to 2024 is the fastest growth rate on record.
| Statistic | Figure | Source |
|---|---|---|
| US cat-owning households (2025) | 49 million | APPA National Pet Owners Survey, 2025 |
| Previous figure (2023) | 40 million | APPA, 2023 |
| Year-on-year ownership growth | +23% | APPA, 2024 |
| Total estimated pet cats in the US | 74 million | Catster, 2025 |
| US households with 3+ cats (growth since 2018) | +36% | APPA, 2024 |
| Single-cat households (2024) | 58% | APPA, 2024 |
| Single-cat households (2018) | 64% | APPA, 2018 |
| State with highest cat ownership rate | Vermont (44.6%) | Catster, 2025 |
| State with lowest cat ownership rate | Rhode Island (16.7%) | Catster, 2025 |
| % of homeowners with cats | 39% | Catster, 2025 |
| % of renters with cats | 29% | Catster, 2025 |
| Total US cat and dog population | 163.6 million | AVMA, 2025 |
The trend toward multi-cat households is notable. As single-cat ownership declines proportionally, households with two cats have grown 8% since 2018, and those with three or more have jumped 36%. This signals that committed cat owners are deepening their investment rather than new single-cat adopters driving overall growth.
Cat Ownership Demographics
Who owns cats — and how that's shifting — matters enormously for understanding the future of the cat industry. Millennials currently lead, but Gen Z is reshaping the market in ways that will have decade-long implications.
| Statistic | Figure | Source |
|---|---|---|
| Millennials as share of all pet owners | 30–33% (largest group) | APPA, 2025 |
| % of Millennials who own a cat | 59% of Millennial pet owners | Healthline, 2025 |
| Gen Z as share of pet owners | 16–20% | APPA, 2025 |
| Baby Boomers as share of pet owners | 24–25% | APPA, 2025 |
| Average number of cats per cat-owning household | 1.8 (down from 2.2 in 1987) | AVMA, 2025 |
| Gender split of cat ownership | 52% male / 48% female | PetsCare, 2025 |
| Cat owners using some form of training | 48% (+41% since 2018) | APPA, 2024 |
| Pet owners who say pets are "like their own child" | 82% | Harris Poll, 2024 |
One counterintuitive data point: men slightly edge out women in cat ownership (52% vs 48%), challenging the cultural stereotype of cats as exclusively female companions. Gen Z is emerging as the generation most likely to treat pets as family, to use social media to drive pet product discovery, and to insist their animals.
Cost of Owning a Cat

Understanding the true cost of cat ownership is one of the most-searched topics in the pet space. A striking 38% of new cat owners report they were not financially prepared for actual pet care costs — making accurate cost data especially valuable.
| Expense Category | Annual Cost (US) | Source |
|---|---|---|
| Total annual cat ownership cost (average) | $653 | World Animal Foundation, 2025 |
| Total annual cat ownership cost (range) | $961–$2,487 | Catster, 2025 |
| Monthly cost of cat ownership | ~$41/month | Capital One Shopping, 2024 |
| Annual food expenditure | $194–$310 | AVMA / Catster, 2025 |
| Routine vet visit cost | $198–$202 average | AVMA, 2025 |
| Annual surgical vet visit cost | $232 | World Animal Foundation, 2025 |
| Initial setup costs (adoption + supplies) | $314–$755 | Catster, 2025 |
| Cat insurance average monthly premium | $19–$32/month | Dogster / Catster, 2025 |
| % of owners unprepared for actual costs | 38% | Catster, 2025 |
| Average annual spending (Canada) | ~USD $1,818 | World Animal Foundation, 2025 |
| Average annual spending (Australia) | A$1,656 (~USD $1,094) | World Animal Foundation, 2025 |
Cat vs Dog: Annual Cost Comparison
Dog: $912/year average (US)
This gap is narrowing as cats receive more proactive healthcare, premium nutrition, and enrichment than in previous decades. Unexpected vet bills are the primary driver of financial stress: 25% of cat owners would find an unexpected expense of $250 or less anxiety-inducing.
Cat Health & Veterinary Statistics
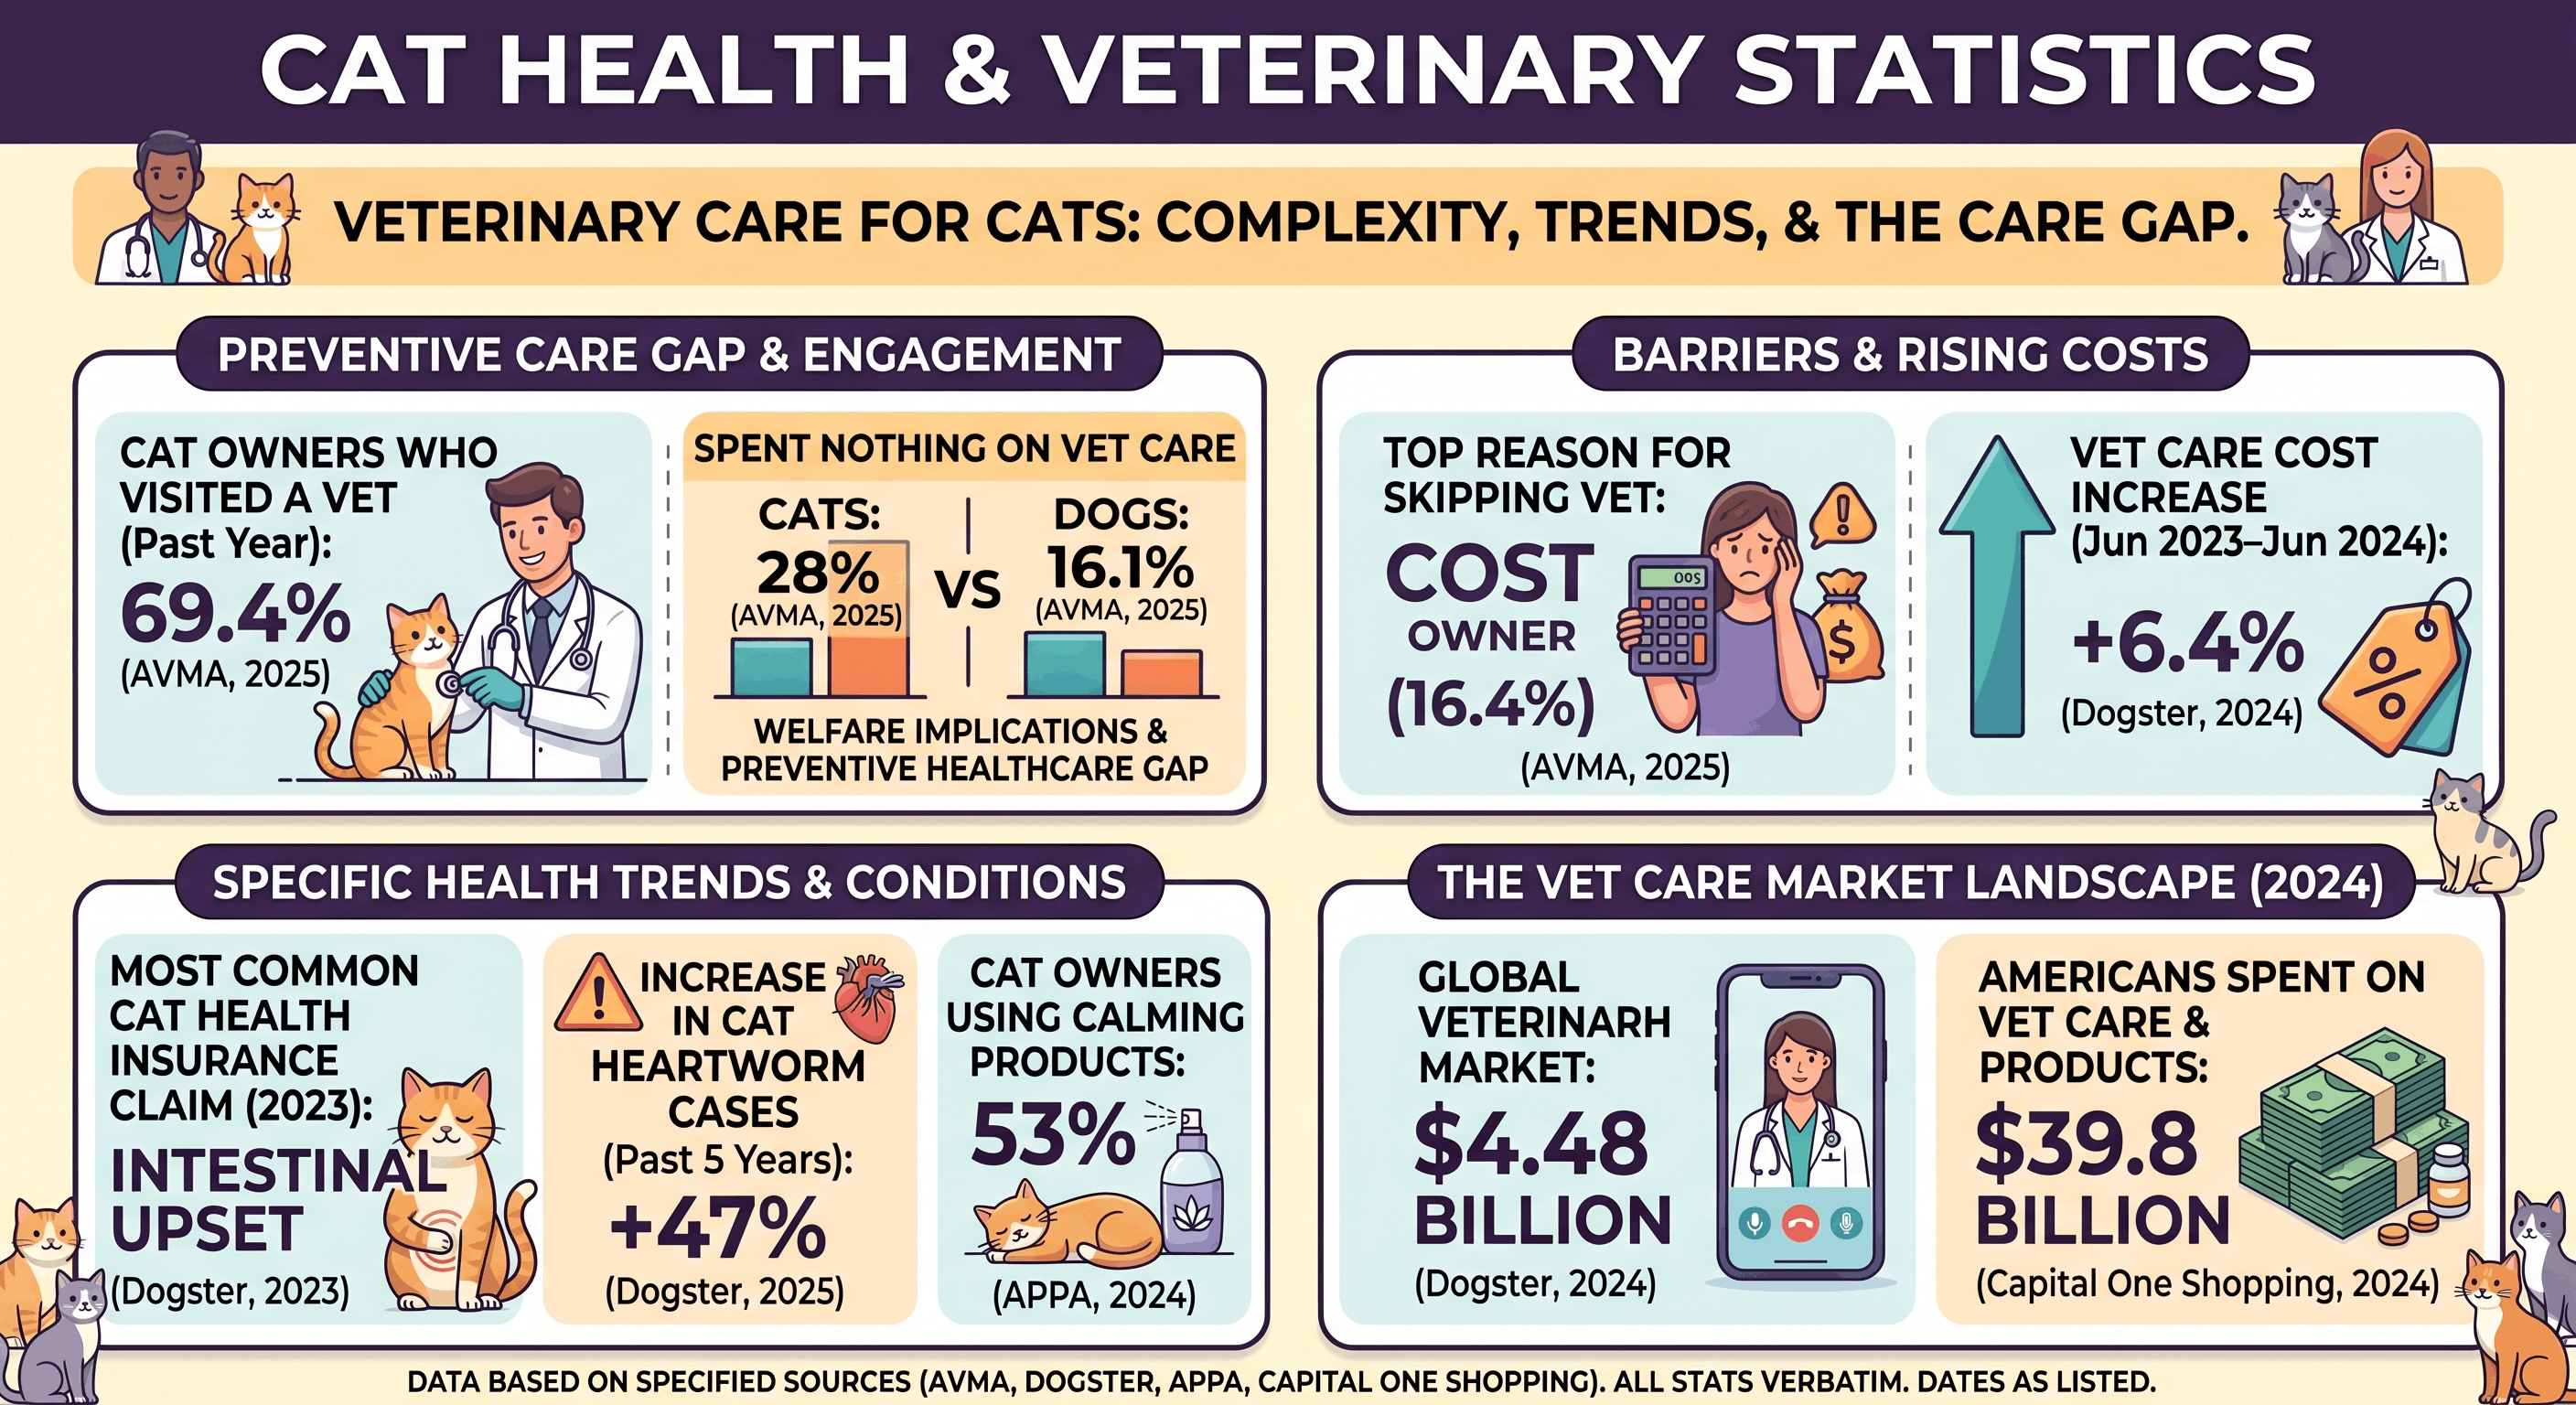
Veterinary care represents a growing and increasingly complex area of cat ownership, with notable differences between cats and dogs in how owners engage with professional care — and a significant gap in preventive healthcare that has welfare implications.
| Statistic | Figure | Source |
|---|---|---|
| Cat owners who visited a vet in the past year | 69.4% | AVMA, 2025 |
| Cat owners who spent nothing on vet care | 28% | AVMA, 2025 |
| Dog owners who spent nothing on vet care | 16.1% | AVMA, 2025 |
| Top reason for skipping vet: cost | 16.4% | AVMA, 2025 |
| Vet care cost increase (Jun 2023–Jun 2024) | +6.4% | Dogster, 2024 |
| Most common cat health insurance claim (2023) | Intestinal upset | Dogster, 2023 |
| Increase in cat heartworm cases (past 5 years) | +47% | Dogster, 2025 |
| Cat owners using calming products | 53% | APPA, 2024 |
| Global veterinary telehealth market (2024) | $4.48 billion | Dogster, 2024 |
| Americans spent on vet care and products (2024) | $39.8 billion | Capital One Shopping, 2024 |
The Cat Vet Gap
Cat Insurance Statistics
Pet insurance for cats is one of the fastest-growing financial products in the pet industry, with Gen Z driving adoption rates that dwarf those of older generations — a structural shift that will reshape how veterinary services are accessed and priced over the next decade.
| Statistic | Figure | Source |
|---|---|---|
| Growth in insured cats (US, 2019–2023) | +190% | Dogster, 2024 |
| Average annual growth rate of insured pets (since 2020) | 20% | NAPHIA / BofA, 2025 |
| Gen Z cat owners with pet insurance | 41.5% | Catster, 2025 |
| Millennial cat owners with pet insurance | ~30.4% | Dogster, 2025 |
| Gen X owners with pet insurance | ~13% | Dogster, 2025 |
| Baby Boomers with pet insurance | 2.5% | Dogster, 2025 |
| Gen Z vs Boomers insurance likelihood | 16× more likely | Catster, 2025 |
| Average annual cat insurance premium (US) | $384 | Dogster, 2025 |
| Average monthly cat insurance premium | $19–$32 | Catster / Dogster, 2025 |
The generational divide is striking: while only 2.5% of Baby Boomers insure their cats, over 41% of Gen Z cat owners carry insurance — a 16-fold difference. This reflects both higher financial literacy about pet costs and a stronger tendency to view cats as family members deserving of healthcare investment.
Mental & Physical Health Benefits of Cat Ownership

The health benefits of cat ownership are increasingly supported by peer-reviewed research, though the picture is more nuanced than popular media often suggests. The evidence for cardiovascular and cognitive benefits is among the most robust.
| Finding | Detail | Source |
|---|---|---|
| Pet owners reporting positive mental health impact | 86% | American Psychiatric Association, 2023 |
| Pets helping reduce stress and anxiety | 69% of pet owners | APA Healthy Minds Poll, 2023 |
| Cat owners vs dog owners: calming presence | Cat owners more likely to report it | APA, 2023 |
| Cat interaction and cortisol | Decreases stress hormone levels | Multiple studies |
| Cat owners vs non-owners: resting blood pressure | Cat owners had lower resting BP | Multiple studies |
| Pet ownership and cognitive decline (50+ adults) | Associated with slower decline in executive function and episodic memory | Scientific Reports, 2025 |
| Cat ownership and cardiovascular risk | Reduced risk of cardiovascular events | HABRI |
| Cats and autism | Adopting cats reduced child anxiety, improved social skills | Qualitative Social Work, 2024 |
The relationship between cat ownership and mental health is more complex — research results are mixed, and the directionality (do happier people get cats, or do cats make people happier?) remains debated. What is clear is that the physical health benefits, particularly cardiovascular and cognitive, have strong longitudinal evidence behind them.

Cat Adoption & Shelter Statistics
How cats enter homes — through shelters, breeders, or informal rehoming — has significant welfare implications. In a landmark shift, cats overtook dogs as the most-adopted shelter animal in 2023.
| Statistic | Figure | Source |
|---|---|---|
| Cats entering US shelters annually | ~3.2 million | ASPCA / Catster, 2023 |
| Cat adoptions as % of all pet adoptions (2023) | 54% | Catster, 2023 |
| Dog adoptions as % of total (2023) | 46% | Catster, 2023 |
| Increase in cat adoptions since 2019 | +14% | Catster, 2023 |
| Shelter intake-to-adoption rate (2023) | 65% | Catster, 2023 |
| Shelter intake-to-adoption rate (2019) | 59% | Catster, 2019 |
| Where owners acquire cats: pet store | 43% | Catster, 2025 |
| Where owners acquire cats: shelter/rescue | 40% | Catster, 2025 |
| Total US animal shelters and rescue groups | ~14,000 | World Animal Foundation, 2025 |
The adoption rate — the percentage of shelter intakes that result in adoption — has improved from 59% in 2019 to 65% in 2023, reflecting better shelter practices and growing public engagement with adoption culture. This is a meaningful welfare improvement, though it means roughly 35% of intakes still do not result in adoption.
Cat Ownership Trends 2025–2026
Several macro-trends are reshaping cat ownership in ways that have not yet fully appeared in long-term datasets. The humanisation of cats is the defining theme of this era.
| Trend | Key Stat | Source |
|---|---|---|
| US cat ownership growth (single year) | +23% (40M to 49M households) | APPA, 2024 |
| Multi-cat household growth (3+ cats, since 2018) | +36% | APPA, 2024 |
| Cat training adoption | 48% of owners now train cats (+41% since 2018) | APPA, 2024 |
| Cat harness sales | Double/triple digit category growth | APPA, 2024 |
| Online pet product shopping | 51% of pet owners now buy online | PetsCare, 2025 |
| US pet industry spending (2024) | $152 billion | PetsCare / BofA, 2024 |
| Projected US pet industry CAGR (to 2030) | 4.96% | Capital One Shopping, 2025 |
| Post-pandemic cat ownership surge (US estimate) | +40% | PetsCare, 2025 |
Where previous generations viewed cats as low-maintenance companions requiring minimal engagement, today's owners — particularly Millennials and Gen Z — invest in enrichment, training, and quality time in ways that mirror dog ownership patterns of ten years ago. The harness-walking movement and the rise of cat training are visible expressions of this shift.
Frequently Asked Questions
How many people own cats worldwide?
An estimated 350–373 million cats are kept as pets globally. In the US alone, 49 million households own at least one cat as of 2025 (APPA). The number of individual cat-owning households globally is harder to quantify due to varying data collection methods by country.
Which country has the most pet cats?
The United States has the largest absolute number of pet cats, with an estimated 74 million. China is second with 53–71.5 million, and Russia third. However, Russia has the highest rate of cat ownership, with 59% of households owning at least one cat.
How much does it cost to own a cat per year?
US cat owners spend an average of $653 per year on their cat, or approximately $41 per month. This includes food ($194–$310), routine vet care (~$198–$202 per visit), and other supplies. The full range depending on health needs and lifestyle is $961–$2,487 annually (Catster, 2025).
Are cats or dogs more popular?
Dogs remain the most popular pet in the US by household count (65.1 million dog-owning households vs 49 million cat-owning). However, cats are more popular in several countries including France, Russia, and Japan, and in 2023 cats overtook dogs as the most-adopted shelter animal in the US (54% vs 46%).
Is cat ownership good for your health?
Research broadly supports health benefits, including reduced blood pressure, lower cardiovascular risk, decreased cortisol levels, and — in a 2025 18-year longitudinal study — slower cognitive decline in adults aged 50+. 86% of pet owners report a positive mental health impact from their pets, with cat owners specifically more likely to report a calming presence compared to dog owners (APA, 2023).
How many cats are in shelters in the US?
Approximately 3.2 million cats enter US shelters annually (ASPCA). In 2023, the adoption rate for shelter cats was 65% — an improvement from 59% in 2019 — meaning the majority of cats entering shelters are eventually adopted.
What generation owns the most cats?
Millennials currently make up the largest share of pet owners overall (30–33%), with 59% of Millennial pet owners having at least one cat. Gen Z is growing rapidly in pet ownership (now 16–20% of all owners) and leads in multi-pet households and insurance adoption.
How fast is cat ownership growing?
US cat ownership grew 23% in a single year (2023–2024), adding 9 million cat-owning households — the fastest rate on record. Globally, cat ownership has been accelerating since the COVID-19 pandemic, with the US seeing an estimated 40% post-pandemic ownership increase.
Methodology & Sources
This article aggregates data from government bodies, industry associations, peer-reviewed academic journals, and reputable survey organisations. Figures are sourced from the most recent available data, primarily 2024–2025. Where sources differ, ranges are provided rather than a single averaged figure. Most primary data is US-centric or Western-European; regional data is included where available but acknowledged as incomplete for Asia, Africa, and Latin America.
Primary Sources
- •American Pet Products Association (APPA) — 2025 Dog & Cat Report & National Pet Owners Survey
- •American Veterinary Medical Association (AVMA) — 2025 Pet Ownership and Demographics Sourcebook
- •ASPCA — Shelter statistics
- •FEDIAF — European Pet Food Industry Federation Annual Report 2024
- •American Psychiatric Association — Healthy Minds Monthly Poll 2023
- •Human Animal Bond Research Institute (HABRI)
- •North American Pet Health Insurance Association (NAPHIA) — State of the Industry
- •Scientific Reports (Nature) — Rostekova et al., 2025 — Longitudinal relationships between pet ownership and cognitive functioning in later adulthood
- •Bank of America Institute — “Best in Show: US Pet Ownership” May 2025
- •Capital One Shopping Research — Pet Spending Statistics
- •Catster — Cat Ownership Statistics 2026
- •World Animal Foundation — Pet Ownership Statistics
Data limitations: Global cat population estimates vary significantly between sources due to differing methodologies and difficulty counting strays. Readers should treat ranges as indicative rather than definitive. This page is reviewed and updated annually.
Plan Your Cat’s Next Adventure
With 49 million US households owning cats, more families than ever are travelling internationally with their pets. Use our country guides to plan a compliant, stress-free move.
 United States
 United Kingdom
 France
 Germany
 Japan
Japan Australia